How to Debug Your Robot Framework Test Using PyCharm: A Comprehensive Guide
Debugging Robot Framework tests is a crucial part of the development process, ensuring that your automation scripts run smoothly and effectively. PyCharm, a popular integrated development environment (IDE), offers powerful tools to debug your Robot Framework tests seamlessly. In this guide, we will walk you through the step-by-step process of setting up and debugging your Robot Framework tests using PyCharm.
Setting the Stage: Understanding the Challenge
Debugging automated tests can be a daunting task, even for seasoned developers. The challenge intensifies when dealing with complex frameworks like Robot Framework. Developers often find themselves grappling with issues such as identifying errors, understanding the flow of test execution, and pinpointing the root cause of failures. This is where PyCharm, with its powerful debugging capabilities, comes to the rescue.
Configuring Your PyCharm Environment
To effectively debug your Robot Framework tests, it’s essential to set up your PyCharm environment correctly. Start by installing the Robot Framework plugin, which provides valuable features tailored for Robot Framework development. Additionally, ensure that your project interpreter is correctly configured, allowing seamless integration between PyCharm and Robot Framework.
Creating Debuggable Test Cases
Writing test cases in a debuggable manner is pivotal. Utilize meaningful variable names and incorporate descriptive comments within your test scripts. This practice not only enhances code readability but also simplifies the debugging process. PyCharm’s debugger will be more effective when your code is well-organized and comprehensible.
Install the Robot Framework Plugin
To enhance PyCharm’s functionality for Robot Framework, you’ll need to install the Robot Framework plugin. Follow these simple steps:
Go to File > Settings (Windows/Linux) or PyCharm > Preferences (macOS).
In the Settings/Preferences dialog, navigate to Plugins.
Search for “Robot Framework” in the Marketplace and install the plugin if it’s not already installed.
Create a Robot Framework Test
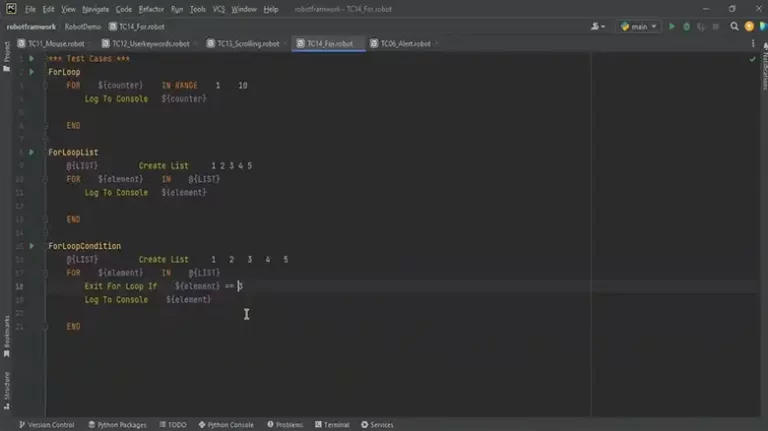
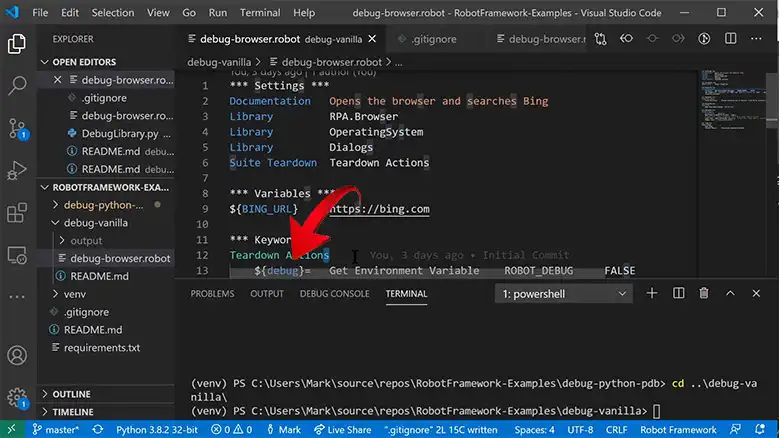
With the plugin installed, you can now create your Robot Framework test script. Start by creating a .robot file (for example, my_test.robot) in your project directory. Write your Robot Framework test script within this file. This script will be the foundation for your debugging process.
Set Up Debug Configuration
To initiate the debugging process, you need to set up a debug configuration in PyCharm. Here’s how you can do it:
Right-click on your .robot test file in the PyCharm project explorer.
Select “Create ‘Robot Framework’ run configuration.”
Step 6: Configure Run Configuration
In the Run Configuration dialog, you have the opportunity to specify various parameters for your Robot Framework test script. Ensure that you check the “Run in debug mode” option. This setting is crucial as it enables the debug mode, allowing you to identify issues in your test scripts effectively.
Start Debugging
Now comes the exciting part! Click the Debug button or press Shift + F9 to start debugging your Robot Framework test. PyCharm will initiate the test execution in debug mode. During this process, PyCharm will pause at breakpoints, allowing you to inspect variables, step through the code, and perform other necessary actions.
You can also start the debugging process by following these steps:
Set Breakpoints
Setting breakpoints is essential for pinpointing specific areas in your test script where you want the execution to pause. To set breakpoints, simply click in the gutter (the area to the left of your code) where you want the execution to pause. This feature is invaluable when you want to closely examine particular sections of your code.
Utilize Debugging Controls
PyCharm provides standard debugging controls that simplify the debugging process. Familiarize yourself with options like “Step Into” (F7), “Step Over” (F8), and “Resume” (F9). These controls allow you to navigate through your test script seamlessly, making the debugging process more efficient.
View Variables
While debugging, you can view the values of variables by hovering over them or by utilizing the debug panel in PyCharm. Understanding the variable values at different stages of the execution can help you identify logical errors and troubleshoot effectively.
Stop Debugging
Once you have thoroughly examined your test script and resolved any issues, it’s time to stop the debug session. You can do this by clicking the red square “Stop” button or pressing Shift + F2. This action concludes the debugging process, allowing you to move forward with confidence in your Robot Framework tests.
Review the Results
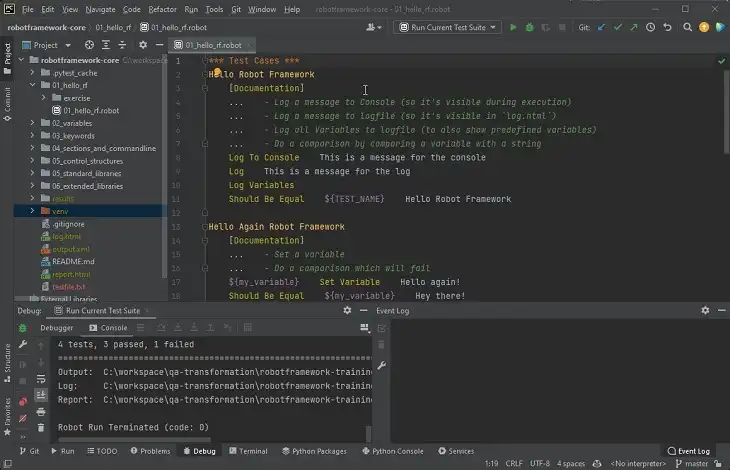
After the debugging session, take some time to review the output in the PyCharm debug console. This detailed output provides insights into the test execution flow and highlights any issues that may have occurred during the debugging process. By carefully reviewing these results, you can ensure that your Robot Framework tests are robust and error-free.
Frequently Asked Questions
How do I debug Robot Framework?
Debugging Robot Framework involves setting up a debugger in an integrated development environment (IDE) like PyCharm and running your Robot Framework test script in debug mode. This allows you to pause the execution, inspect variables, and identify issues effectively.
How to use PyCharm for Robot Framework?
To use PyCharm for Robot Framework, first, install PyCharm on your system. Create a Robot Framework project, install the Robot Framework plugin in PyCharm, and set up a debug configuration for your test script. PyCharm’s debugging tools will help you analyze your tests step by step.
How do I open Robot Framework in PyCharm?
Open Robot Framework in PyCharm by creating or opening a project in PyCharm. Within the project, create a directory for your Robot Framework test files. Then, create a .robot file inside this directory. PyCharm will recognize this file as a Robot Framework test script.
How do I enable debugging actions in PyCharm?
To enable debugging actions in PyCharm, set up a debug configuration for your Robot Framework test script. Right-click on the test file, select “Create ‘Robot Framework’ run configuration,” and configure the necessary settings, including enabling the “Run in debug mode” option. This enables debugging actions in PyCharm, allowing you to debug your tests efficiently.
Conclusion
Debugging your Robot Framework tests using PyCharm is a straightforward and efficient process when you follow these steps. By utilizing PyCharm’s powerful debugging tools, you can identify and resolve issues in your test scripts with ease. Remember to install the Robot Framework plugin, set up breakpoints, and make use of the debugging controls to streamline your debugging experience.
Now that you have a comprehensive understanding of how to debug your Robot Framework tests in PyCharm, you can confidently enhance the quality and reliability of your automation scripts. Happy debugging!